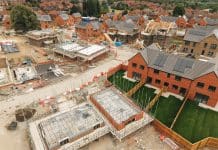
The number of empty homes across England has risen for the second year running, representing £53.6bn worth of vacant stock, analysis by modular homes provider Project Etopia shows
The number of long-term vacant properties rose 5.3% to 216,186 in 12 months to October 2018 according to the latest MHCLG figures, following a 2.6% rise the previous year.
Prior to this, the number of long-term vacant properties had dropped every year since 2008. Of all towns and cities in England, Portsmouth saw the biggest percentage rise in long-term empty homes last year, with 101.5% more properties standing empty, totalling 939.
Hartlepool saw the second biggest rise (53.8% to 726), while Eastbourne posted the third largest increase (48.4% to 518). Birmingham had the highest overall number in the country with 4,283 long-term vacant homes, barely changed on the previous year and rising just 0.07%, followed by Durham with 4,130 and Bradford with 4,090.
Across England, long-term vacant homes — those that have been empty for at least six months — are worth a collective £53.6bn.
Biggest Risers: These are the Top Ten towns/cities in England with the largest increases of long-term vacant homes:
| Town/City | 2017 | 2018 | Change (%) | |
| 1 | Portsmouth | 466 | 939 | 101.5% |
| 2 | Hartlepool | 472 | 726 | 53.8% |
| 3 | Eastbourne | 349 | 518 | 48.4% |
| 4 | Woking | 235 | 346 | 47.2% |
| 5 | York | 359 | 527 | 46.8% |
| 6 | Harlow | 225 | 322 | 43.1% |
| 7 | Bedford | 431 | 613 | 42.2% |
| 8 | Maidstone | 342 | 485 | 41.8% |
| 9 | St Albans | 286 | 402 | 40.6% |
| 10 | Norwich | 335 | 462 | 37.9% |
The following table shows the ten towns/cities in England with the highest numbers of long-term vacant homes (excluding London):
| Town/City | 2017 | 2018 | Change (%) | |
| 1 | Birmingham | 4,280 | 4,283 | 0.07% |
| 2 | Durham | 4,539 | 4,130 | -9.0% |
| 3 | Bradford | 3,931 | 4,090 | 4.0% |
| 4 | Liverpool | 3,889 | 3,703 | -4.8% |
| 5 | Leeds | 2,709 | 2,788 | 2.9% |
| 6 | Sheffield | 2,204 | 2,433 | 10.4% |
| 7 | Sunderland | 1,779 | 1,893 | 6.4% |
| 8 | Stoke-on-Trent | 1,518 | 1,865 | 22.9% |
| 9 | Newcastle upon Tyne | 1,595 | 1,792 | 12.4% |
| 10 | Doncaster | 1,628 | 1,683 | 3.4% |
London has also seen another rise in the number of long-term empty homes, its second increase since 2009. The total number of long-term vacant properties in the capital grew 11.1% to 22,481 in 2018 — representing £10.7bn worth of property.
Southwark (1,766 vacant properties) has replaced Croydon (1,521) in top spot, which has dropped down to 10th. The city of London is second with 244 empty homes (a 54.4% rise) and Sutton is third with 686, a 46% rise.
Southwark has seen the biggest rise of any borough in the top ten, with a surge of 56.6%.
The following table shows the Top Ten London boroughs for long-term vacant homes:
| London Borough | 2017 | 2018 | Change (%) | |
| 1 | Southwark | 1,128 | 1,766 | 56.6% |
| 2 | City of London | 158 | 244 | 54.4% |
| 3 | Sutton | 470 | 686 | 46.0% |
| 4 | Richmond upon Thames | 344 | 488 | 41.9% |
| 5 | Greenwich | 600 | 830 | 38.3% |
| 6 | Wandsworth | 132 | 173 | 31.1% |
| 7 | Havering | 494 | 630 | 27.5% |
| 8 | Newham | 709 | 894 | 26.1% |
| 9 | Lambeth | 734 | 920 | 25.3% |
| 10 | Croydon | 1,264 | 1,521 | 20.3% |
Joseph Daniels, CEO of Project Etopia, said: “This remains a national scandal that isn’t going away, pointing to a collective failure to really get to grips with this problem.
“The stubbornly high number of empty homes is compounding the housing market’s deeply entrenched problems with lack of supply remaining a key driver of high prices and low affordability.
“New homes are not being built fast enough and the constant spectre of abandoned properties aggravates an already tough market, particularly for first-time buyers who desperately want to claim the keys to their first property.”


