
Damian Keeley, a UK-based architect at Size Architects, explains how to harness the power of BIM in Vectorworks Architect
In Vectorworks, there are a variety of ways to work with data. One of those ways is record formats, which function as mini databases that you apply to individual items in your model.
I like to think of using record formats as adding a custom tag to an element in a model.
The beauty of the feature is that it can be added to pretty much any element within the model.
The setup is the same for illustrating values of acoustic ratings, fire ratings, thermal efficiency, or security resistance ratings.
You can even have your project phases colour-coded in your model, such that new or demolished elements are all in different colours so that you can quickly see which walls are to be demolished.
Then, you can similarly create record format or a mini database entry in your model. You can set up as many versions of these records as you like, and they’re a way to insert or embed your chosen data into the model.
Record Formats are then attached to the specific elements you choose, with your own chosen values selected from a predetermined drop-down list.
It’s so flexible, and updating a concept model with a new fire strategy is easy without replacing elements like wall types. It’s a very fast, powerful tool for illustrating what is important to you in your design and comes straight out of your own model.
A fire rating example
For example, you could produce a record format of a fire rating for wall types, which would involve creating a new fire rating record.
Typically, approval drawings will have a range of different fire ratings that are needed in a project, and these different ratings are stored as values in the record format.
These values (30 minutes, 60 minutes, 90 minutes, 120 minutes, etc.) are all stored within the fire rating record that you create.
They’re selectable from a drop-down list, so you can select a building element (a wall or a door, for example) and then the required fire rating, say 30 minutes.
Once you’ve embedded some data in your model, you can visualise it by creating a data visualisation rule set. This rule applies to a viewport and says, for example, all 30-minute fire objects are to be red.
So, in a viewport of your model, you can select a graphical style — the data visualisation — that will show the assigned data values in different colours of your choosing. This overrides the display style of your model directly in the design layers or in any viewport to which you apply a data visualisation.
Just like you can create multiple record formats to apply to your model simultaneously, you can also create a number of data visualisation rule sets in one model and apply them according to what you want to show.
The key idea here is that we don’t need to duplicate walls or fills for each wall colour that we want to graphically display as somehow different depending on our subject of analysis; it’s all done with the one model; it’s just viewed through a different lens (or data visualisation) attached to each viewport.
Data visualisations work by taking, say, a typical black-and-white general arrangement plan and telling different data or values to be different colours, so instead of being a black-and-white plan drawing, the display style (if you wanted to focus on fire rating in a viewport on a fire strategy drawing) will pick out all of your 30-minute fire-rated elements and show them in red, if you so wish.
You can pick out your 60-minute rated elements in orange and two-hour rated elements in blue.
Exactly what you pick out and how it’s displayed is customisable and can be chosen in your record formats applied to the objects in the model and the data visualisation applied to the viewports.
The potential to apply these data records to individual objects in the model means there are many different uses — you could pick out U values of your envelope to display those better-performing / higher-insulated U values in green and the worst-performing or lower-insulated U values in red.
You can also set up a drop-down list to select values within your custom Record Format. This simplifies the speed of tagging your model as you go.
How to create a record format
You can create a new record format within the resource manager. Once you’ve created a record format, you can use it in other projects.
To create a record format:
1. In the resource manager, change the filter from all resources to record formats.
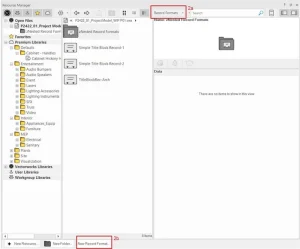
2. Click new record format.
3. Name the record format. We’ll call this one “fire performance.”
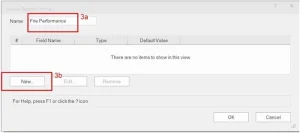
4. Now, we’ll add a few fire ratings. Click New, and then we’ll name the field “fire ratings.” For the type, click the down arrow and select pop up from the list.
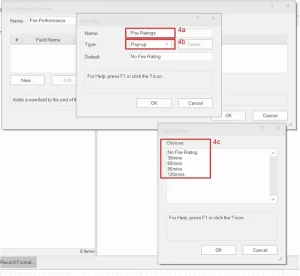
5. Under choices, add a different choice value to each line. Be sure to click OK and save this a few times as you’re filling out the values.
Apply record formats to an object
In your model, select all the objects that you’ll want to contain the data choices from the record format you created. In this model, I’ve used the select similar tool to select all the walls and the doors.
In the Object Info Palette (OIP), click on the data tab and select attach record. This will add the “mini database” we’ve created to the selected walls and doors.
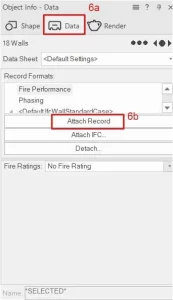
In the resource manager, click on your “fire performance” record. These walls have now all been assigned the default value, which, in this case, is “no fire rating.”
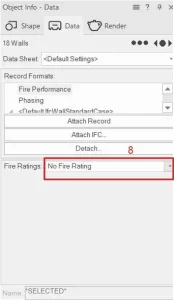
Select the walls that will be 60-minute fire rated. Then, click on the “fire ratings” drop-down list and select the appropriate fire rating.
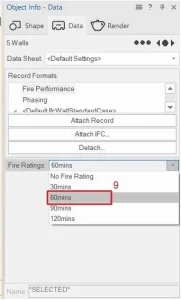
We can then select other walls and assign them their own, appropriate fire rating.
Now that we’ve done that, we’re ready to choose how we wish to see those values displayed as graphics in the floor plan.
Creating a new data visualisation rule set
While in your model, let’s click on the data visualisation drop-down menu in the top view bar and then select new data visualisation.
Apply the display criteria from the default all objects and select objects using record.
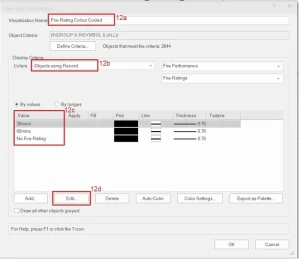
The values will then automatically be applied to objects tagged in your model — in this example, we have “no fire rating,” “30-minute,” and “60-minute.”
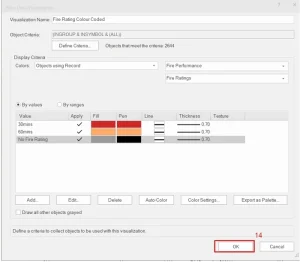
Click on the fire rating you’d like to define and click edit. In this instance, I’ve chosen to override the fill of the wall with red for a 30-minute fire rating.
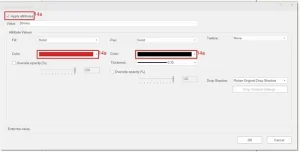
Similarly, I made the “60-minute” walls orange and the “no fire rating” walls grey.
Applying the data visualisation to viewports
In the active sheet layer, select a viewport to which you wish to apply your new data visualisation.
In your OIP, scroll down until you see data visualisation, and select your style from the list.
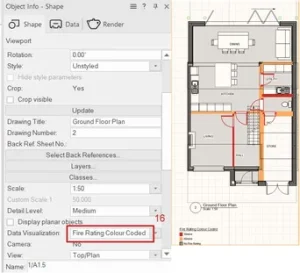
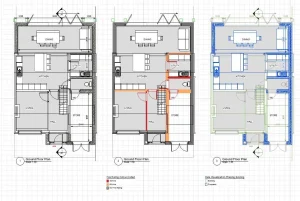
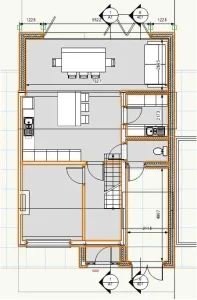
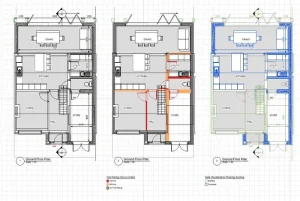
In the current model example, I’ve shown a phasing visualisation of existing, proposed, and a fire rating example. You’ll notice that the phasing hatch types keep the hatching in the original wall types, whereas we choose a full-fill, flat-colour for the fire rating visualisation.
Other ways you can effectively use data visualisation include:
- Fire resistance
- Acoustic ratings
- Thermal performance
- External walls, internal walls, party walls
- Load-bearing walls and non-load-bearing walls
- Existing, demolition, and new-build


